The Line Style button is exposed from the Component ribbon when working with line, point, lollipop, area, stream, plotted, and radar charts. By default, a solid line is displayed when working with these charts. Click the Line Style button to toggle between dotted or solid line, or open the Line Style drop down to select one of three line styles: dotted, dashed, or solid.

By default, the given line type is applied to all lines in the chart. You may apply a line style to specified member elements only via series editing. To do this, edit the required series member from the legend; choose the line type from the series editing dialog (green highlight below).

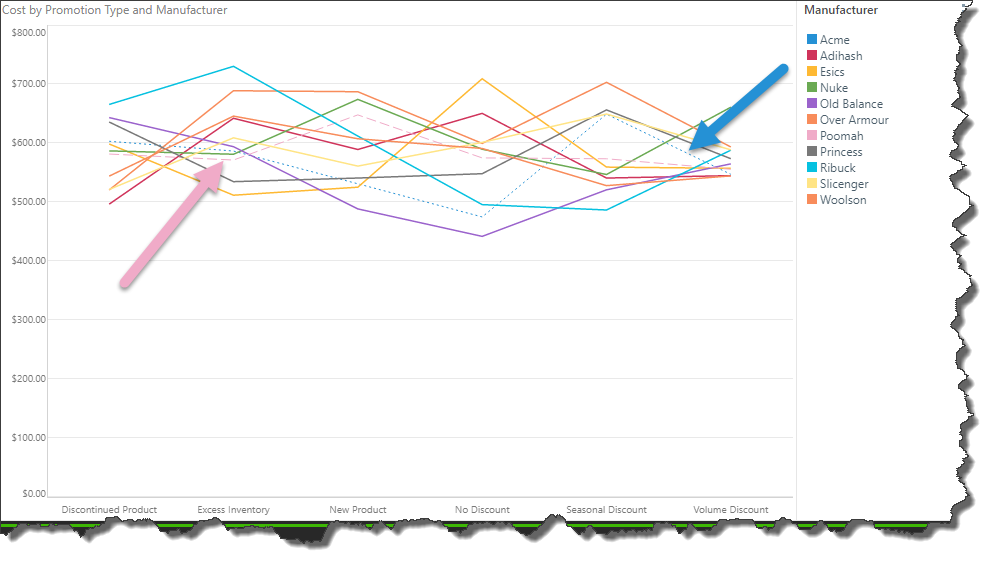
In the image below, the default solid line style is applied to all series members except 2; a dashed line was applied to the Poomah series (pink arrow) and a dotted line to the Acme series (blue arrow).
Plotted Charts
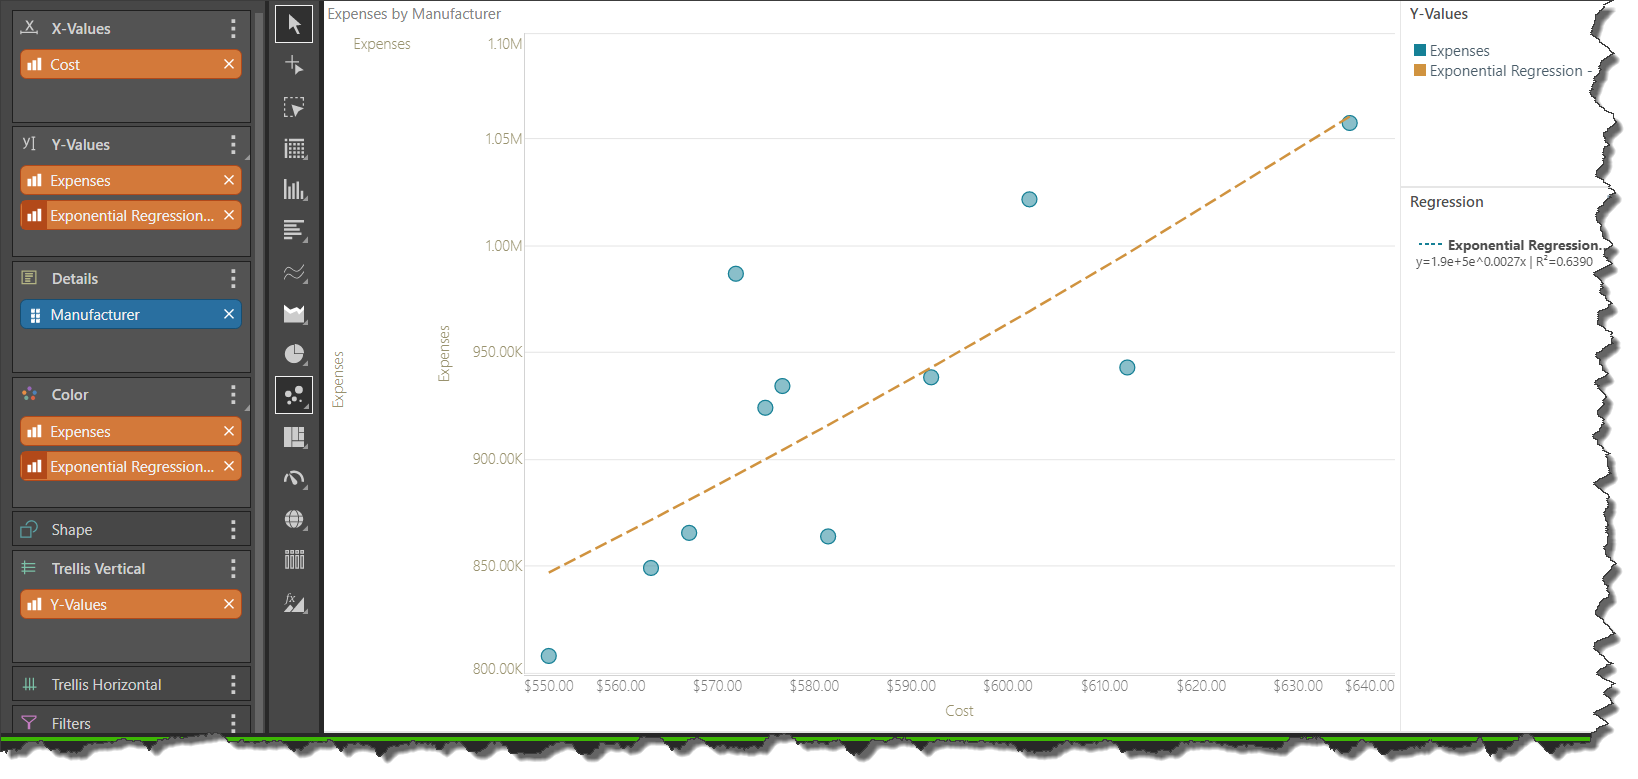
When working with plotted charts, the line style function is enabled only when a regression line is added to the chart.
Examples
This example shows a line chart with the default solid line style:

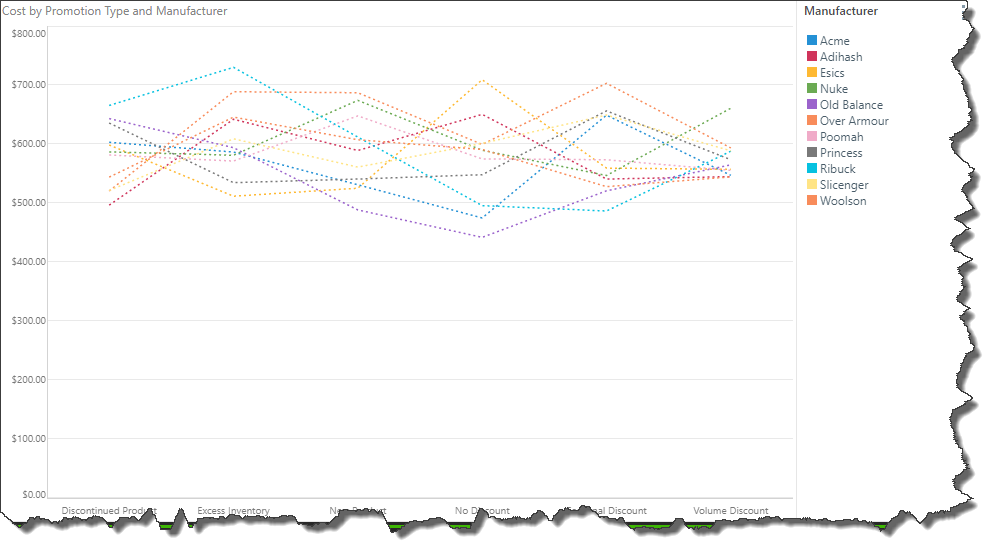
Here we see the dotted line style:
Here we see the dashed line style:
